Results
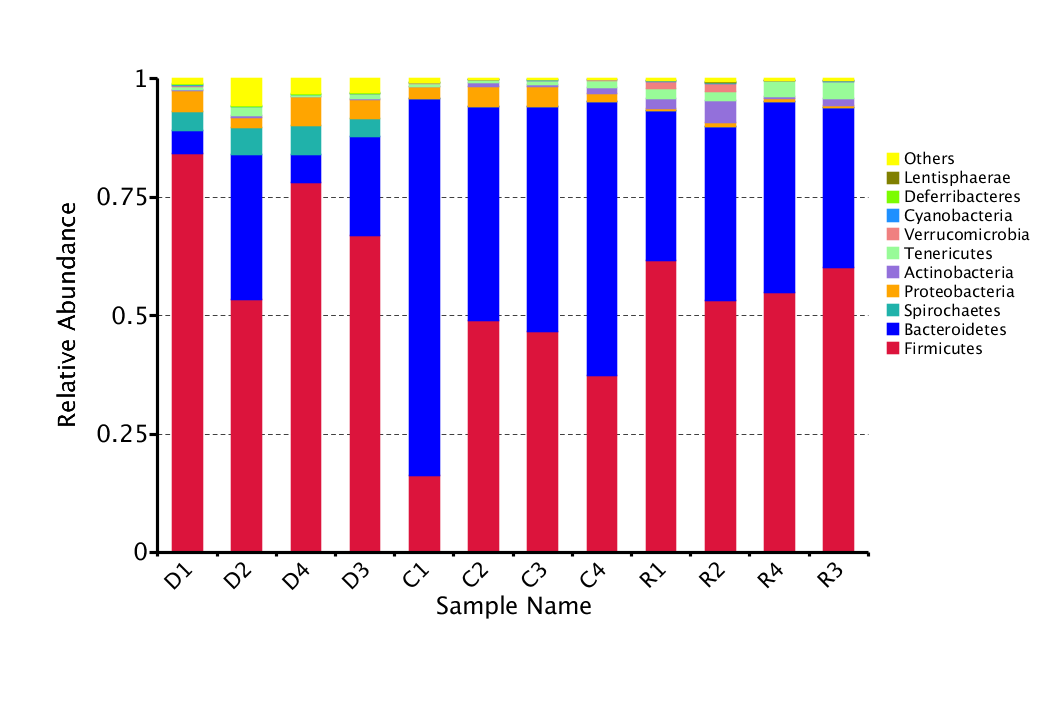
Novogene sent back the DNA sequences organized by OTUs and species annotations. Their data included various graphs and the graph above depicts the top ten common species relative abundance in bacterial phyla for every sample. D represents deer mice, C represents C57/B6 mice, and R represents Fischer rats. The numbers after the capital letters signify the sample numbers.
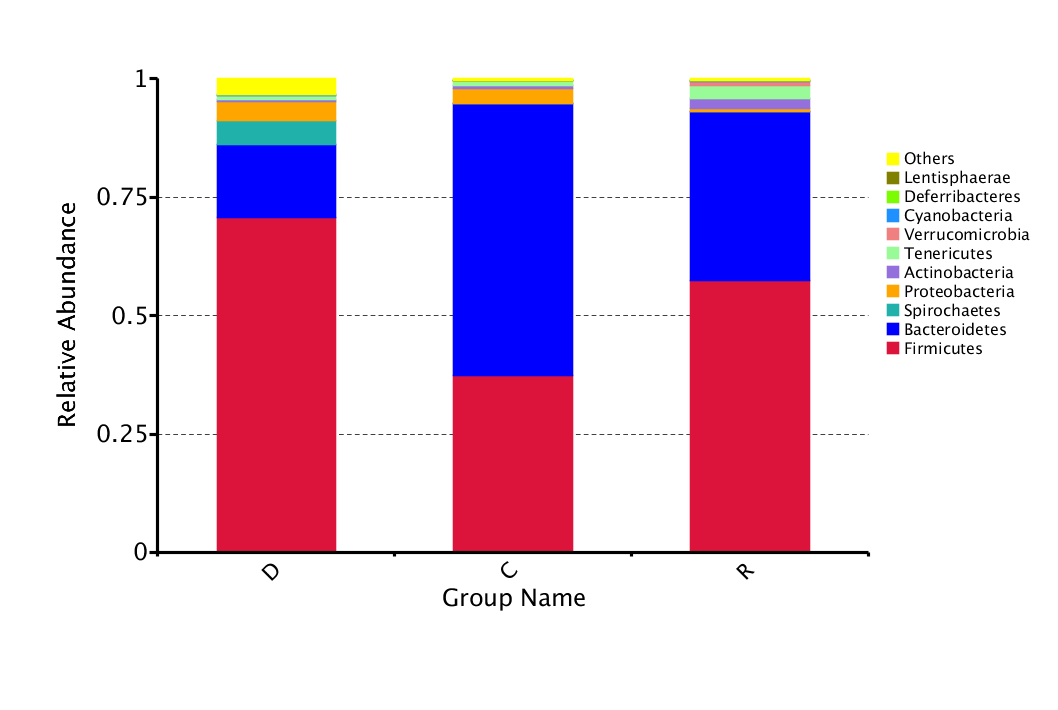
The graph above depicts the average relative abundance of the top ten gut microbiome phyla in the deer mice, C57/B6 mice, and Fischer rats. The capital letters represent the same species groups as above.
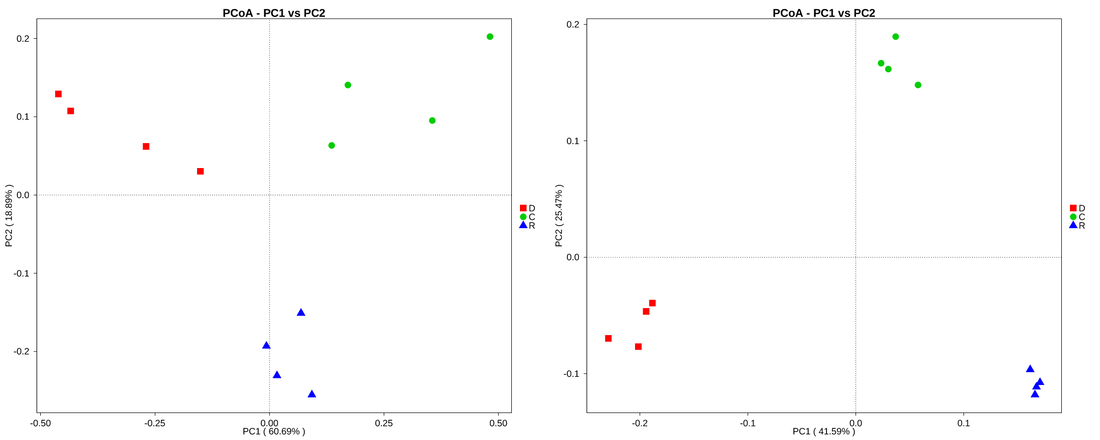
Above are two PCoA graphs. PCoA stands for principal coordinates analysis and it is a technique that “picks up the main elements and structure from reduced multi-dimensional data series of eigenvalues and eigenvectors”. The left one is based on Weighted Unifrac distance and the right one is based on Unweighted Unifrac distance. By incorporating the Weighted Unifrac distance, the graph is based on quantitative accounts for the abundance of observed organisms. On the other hand, the right graph based on the Unweighted Unifrac distance is based on the presence or absence of the OTUs. Therefore, the Weighted Unifrac distance provides an informational graph about the similarity of the most abundant OTUs. However, the Unweighted Unifrac distance graph provides important information on even the low abundance OTUs.
Discussion
- Top three bacterial phyla in high abundance in deer mice:
- Firmicutes
- Bacteroidetes
- Spirochaetes
- Top three bacterial phyla in high abundance in C57/B6 mice:
- Bacteroidetes
- Firmicutes
- Proteobacteria
- Top three bacterial phyla in high abundance in Fischer Rats:
- Firmicutes
- Bacteroidetes
- Actinobacteria
Another project studied the fecal samples of human patients who were going through chemotherapy. Sometimes chemotherapy is given to patients who are about to receive stem cell transplants so in this case fecal samples were taken before and after the chemotherapy and analyzed. This research found that even chemotherapy can affect the composition of the gut microbiome. They found a decrease in Firmicutes and Bacteroides and a increase in Proteobacteria.
